Overview: |
MY RATINGS:
|

|
Location Data:
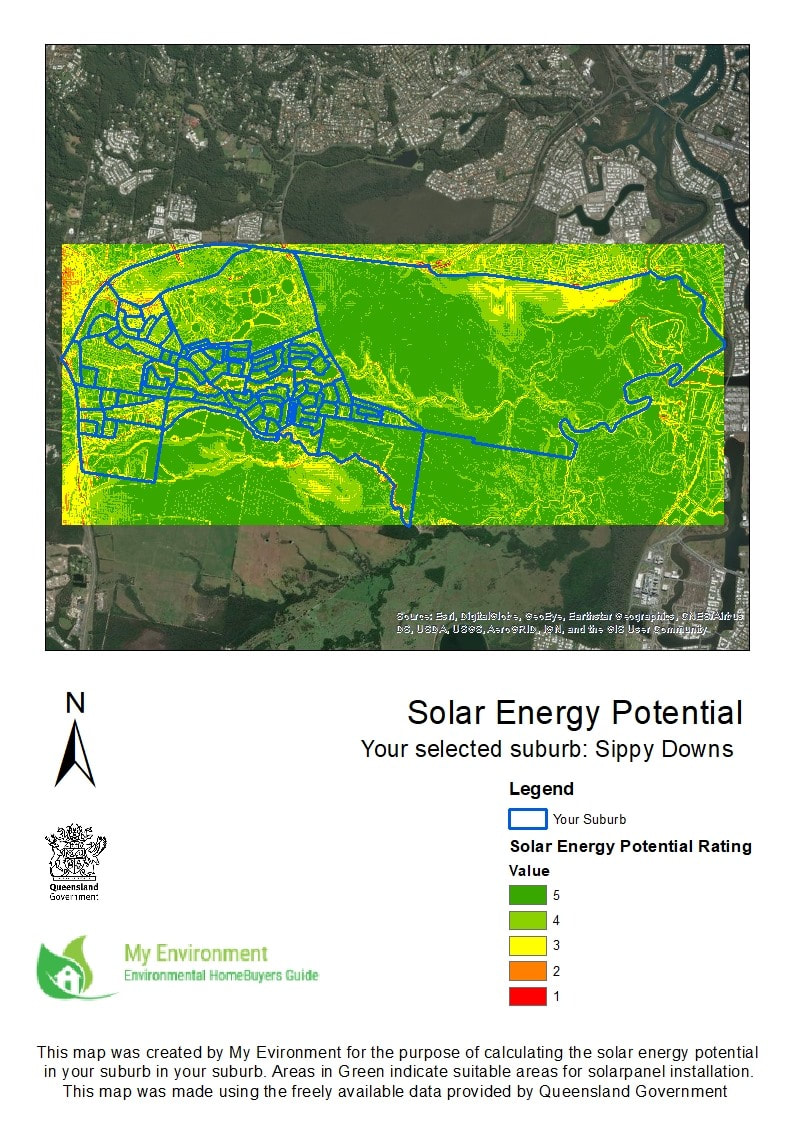
Latitude: -26.727733 Longitude: 153.069956 Water Efficiency: From the usage of installing water tanks to collect rainfall it can be estimated that up to 4000 Liters per month of water can be saved. Solar Efficiency: From the Usage of installing Solar panels within the residence an estimated amount of 800KWh per month of power can be saved. |
|


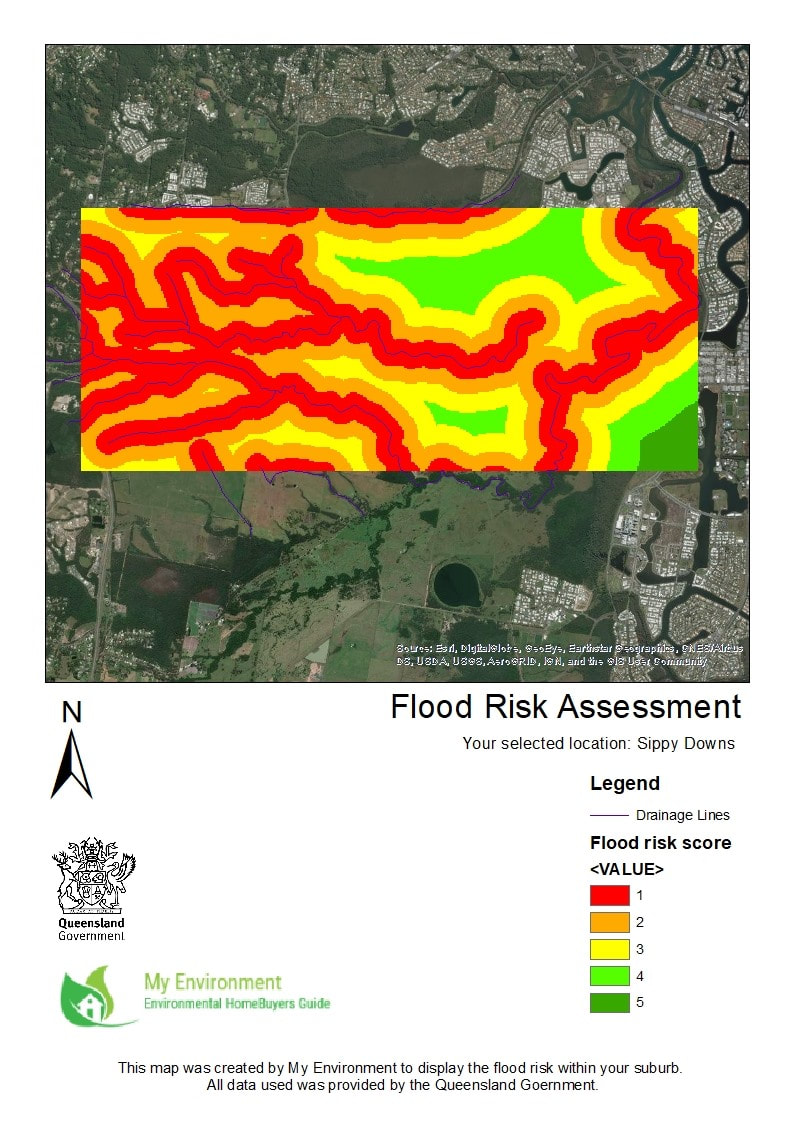
Flooding Data and Water efficiency:
|
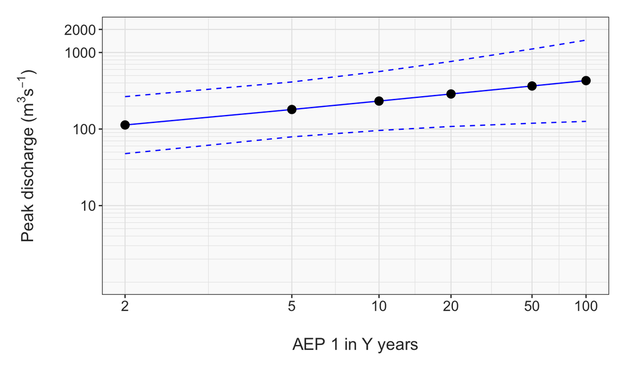
Flood Frequency Analysis: The Flood Frequency Analysis Enables you to identify the Annual Exceedance Probability (AEP) of a given peak discharge with the property area. i.e. A flood with a discharge of 100 cubic meters per second will have an AEP of 1 in 2 years. |
|
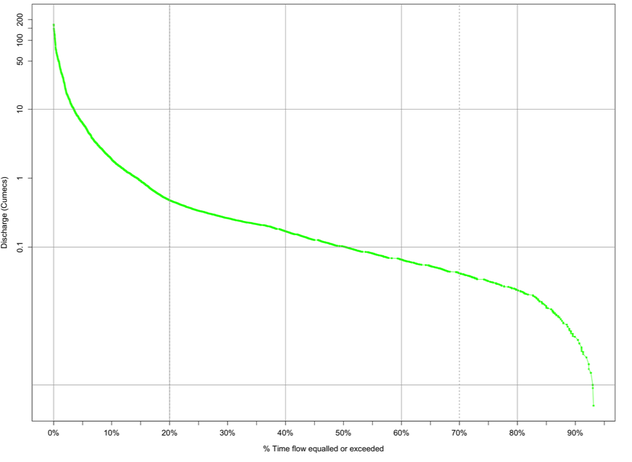
Flood Distribution Curve:
The Flood Distribution Curve identifies the Given magnitudes of the flood peaks in the area and the percentage of time that the discharge magnitude is equalled or exceeded. As to find the percentage of time a flood magnitude is exceeded the discharge magnitude is determined then the corresponding exceedance percentage is identified from the graph. i.e. A flood with a discharge magnitude of 0.75cubic meters will have an exceedance percentage of 20%. |
|
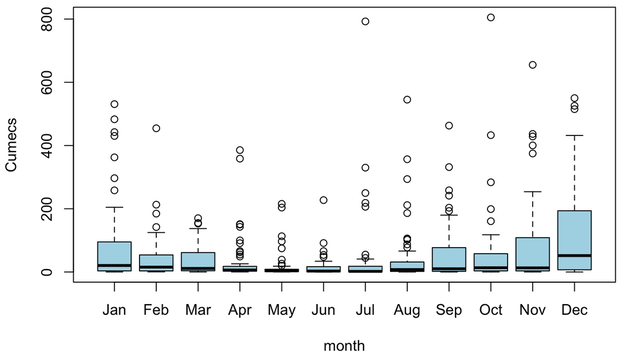
Monthly Discharge Variation:
As The Monthly Discharge Variation of the location displays the distribution of the rainfall data during the month. Identifying the Wet and Dry seasons, Extreme flow Discharges and the Average Discharges and inter quartile range for month. i.e. The Wetter Months can be identified as December, November and January with February having an average discharge of 10 cubic meters. |